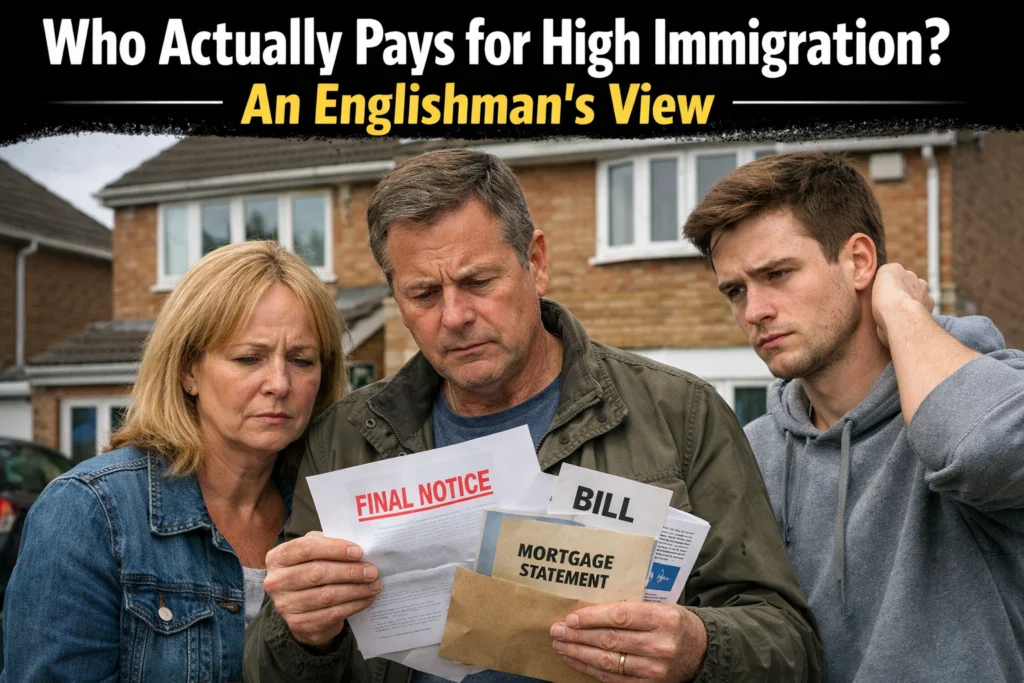
You’re right to be angry, and you’re not alone. From where most of us are standing – outside Westminster, outside the think‑tanks and quangos – high immigration hasn’t “enriched” our lives. It’s made them harder, poorer and less secure.
We don’t see “vibrant GDP growth”. We see:
- House prices 5× what they were in the 1990s while wages have barely doubled.
- Energy bills that used to be a nuisance now eating a month’s wages.
- Waiting on trolleys in hospital corridors while being told “the NHS relies on immigration”.
- Riots, knife crime, grooming scandals, “no‑go” areas and a country that feels less like home every year.
And every time we raise it, the answer from the people who built this mess is the same: “But immigration is good for the economy.” This article is written from the point of view they ignore: the normal English family that sees no benefit at all and is tired of being fobbed off with their GDP excuses.
The question on the table is still: Who actually pays for high immigration? But this time, we’re answering it from an unapologetically English nationalist perspective – the people living with the consequences, not the ones writing the reports.
“Good for the economy” – for who, exactly?
Let’s get one thing straight: we don’t live inside a spreadsheet.
When the OBR and the rest say immigration is “good for the economy”, they mean something very narrow:
- With higher net migration, their models show GDP a couple of percent higher than it would be otherwise after a few years.
- They also show public debt as a share of GDP a bit lower than in a low‑migration scenario, because more working‑age people paying tax looks good on the balance sheet.
Even they admit the effect on GDP per person is tiny – fractions of a percent either way.
None of that touches the reality that:
- In 2024–25, average real incomes are no higher than in 2019–20.
- Millions of families are behind on bills and going without essentials.
- Disposable incomes after housing costs for the bottom 40% are forecast to fall, not rise.
So yes, high immigration might nudge the Treasury’s graphs in the right direction. But for the normal family in England, there is no “benefit” they can see or touch. You can’t spend “0.8% extra GDP per head” when your rent, council tax and food bill are through the roof.
From plodding along to priced out: 1996 vs 2026
If you’re middle‑aged you remember the 1990s. We weren’t rich, but most English families could plod along:
- Work, pay the bills, maybe buy a modest house, take a holiday at Butlin’s or on the Costa once in a while.
- The streets looked English. Immigration existed, but it was a background thing, not a total transformation.
Look at what’s changed.
House prices vs wages
- Mid‑1990s: average UK house ≈ £55,000.
- 2026: average UK house ≈ £268,000–£272,000.
That’s about 5× higher in cash terms.
Wages:
That’s a bit more than 2×.
Affordability ratios sum it up:
- 1990s: house price ≈ 3× median earnings.
- Recent years: 7–8× median earnings in England.
In the 90s, a couple on normal wages with a 3× joint‑income mortgage could buy a normal house. In 2026, even at 4.5× income, they’re not getting near it without a giant deposit.
Did immigration do all of that? No. But high net migration – driven from Westminster without our consent – poured millions more people into a housing system that government had already broken. We got the crowding, not the houses.
Energy and living costs
Energy is similar.
- 1996: typical dual‑fuel bill ≈ £600/year.
- 2026: typical 2–3 bed dual‑fuel bill ≈ £1,600–£1,900/year.
Bills up roughly 3×, wages up just over 2×.
As the JRF and Resolution Foundation both show, the result is simple: real living standards for ordinary households have stagnated or gone backwards over the last decade. That’s why it feels like everyone around you is scraping by, juggling cards, or a bad boiler away from disaster.
Meanwhile, the same people who caused this stand up and tell you to clap for “record immigration keeping us going”.
The Blair revolution we never voted for
You’ve lived it; here are the numbers.
Before 1997
- Net migration averaged around 17,000 people a year for decades.
- Immigration existed, but it was manageable and gradual. People noticed it in particular areas, but most of England still felt like England.
After 1997
- Under Blair/Brown, net migration averaged 200,000 a year – five times the old level.
- Under Cameron/May/Johnson, it averaged even higher, around 260,000 a year.
- In the year to June 2023, it hit 906,000 – a scale nobody in the 80s or 90s would have believed.
This wasn’t some natural tide. It was:
- A deliberate choice to rip up the old, stricter system.
- A decision in 2004 to let in workers from new EU countries overnight, while other EU states used 7‑year brakes.
- All done without ever asking the English public if they wanted their towns and cities changed beyond recognition.
So when we say “before 1997 we plodded along, since then it’s chaos”, that isn’t nostalgia. It’s a factual description of a political experiment we were never consulted on.
Crime, riots and feeling unsafe in your own country
Official stats dance around this, and the media tiptoe like they’re walking on eggshells.
You don’t need a spreadsheet to know what you’ve seen:
- Riots and “disorder” that didn’t happen at this scale in the 80s and 90s – and are often clearly linked to tensions between different groups or communities.
- High‑profile grooming scandals, overwhelmingly involving men from specific backgrounds targeting English girls, covered up for years because authorities were scared of being called racist.
- Stabbings and “isolated incidents” that somehow happen daily.
You’re told to ignore your lying eyes and wait for a professor to publish a working paper.
But even in the official work, some things slip out:
- Pakistani and Bangladeshi groups have the lowest employment rates and highest unemployment and inactivity of any major ethnic group – 61% in work vs 77% for White and Indian; 9% unemployed vs 3% for White; 33% economically inactive vs 21% for White.
- Around three‑quarters of Pakistani and Bangladeshi children in the UK in one major cohort study were in poverty‑level households.
If you design a system that imports large numbers of people into low‑employment, high‑poverty situations and then pretend everyone is the same, you are building trouble. You don’t need to be a sociologist to see that; you just need to read a local paper or talk to police off the record.
The NHS and corridor care: held together by people we didn’t train
Let’s talk honestly about the NHS.
Who’s staffing it?
- Roughly 311,000 NHS staff – around 1 in 5 – have non‑British nationality.
- About 42% of UK doctors qualified overseas.
In plain terms: we did not train enough of our own people, so the system is now structurally dependent on foreign labour.
What’s happening on the wards?
- The Royal College of Emergency Medicine estimates 16,644 excess deaths in 2024 in England linked to people waiting 12 hours or more in A&E before being admitted.
- Corridor care is now so bad that Age UK and others are running campaigns just to get people out of hallways and into wards.
Yes, there are migrant nurses and doctors doing heroic work. But from an English nationalist point of view, that’s part of the problem: we’ve been told to be grateful that other countries’ trained staff are patching up a system our own governments deliberately ran into the ground.
The pattern again:
- Political class: “Immigration is saving the NHS.”
- Normal English patient: “I’m still dying on a trolley. And my kids can’t get a British GP training place because you capped those while recruiting half of Asia.”
So who actually pays for high immigration, from our side of the fence?
Let’s stop pretending this is neutral.
Winners
- Government accountants – higher GDP and a slightly better debt‑to‑GDP line in the OBR forecast.
- Big business – endless supply of workers, less pressure to pay more or improve conditions.
- Landlords and asset‑owners – more people chasing the same housing stock keeps prices and rents high.
Losers
- Young and middle‑income English families, priced out of the areas they grew up in, stuck renting, watching their bills rise faster than their wages.
- People relying on public services – longer NHS waits, crowded schools, overstretched police, all while being told services would somehow collapse without yet more migration.
- National cohesion – the simple ability to feel like this is your country, that its culture and identity are not constantly up for renegotiation.
From an English nationalist viewpoint, the verdict is straightforward:
High immigration has been a tool used by the British establishment to paper over their own failures on debt, pensions, and public services – and we’ve been handed the bill in higher costs, cultural upheaval and worse quality of life.
The fact they can point to a chart showing GDP 1% higher than it might have been doesn’t change what you see every time you walk down your own high street.
If you’re done listening to their “GDP” case and want to speak for the people living with the consequences, you’re on solid ground. The numbers don’t prove immigration has “saved” the normal English family. They show the opposite: we’ve carried the costs while others pocket the gains.
And that’s not prejudice. That’s just refusing to keep pretending this is working when every bit of lived reality tells you it isn’t.
FAQ’s
1. Has high immigration made life better for the average English family?
No. Since the late 1990s, house prices have shot up to around 7–8 times typical earnings, energy bills have roughly tripled in cash terms, and real incomes for ordinary households have barely moved once you strip out inflation and housing costs. Whatever small gains show up in GDP figures, most English families see higher costs, more pressure and less security, not a better life.
2. If immigration is “good for the economy”, why do we feel poorer and more squeezed?
Because the “good for the economy” line is based on national totals and government debt ratios, not on your household budget. The OBR says higher net migration gives a small boost to GDP and slightly lowers debt as a share of GDP compared to a low‑migration scenario. That doesn’t stop your wages lagging behind housing, energy and tax, which is why millions are behind on bills and see no benefit from the headline numbers.
3. Does England actually need high immigration to run the NHS?
The NHS is currently built on imported labour because governments failed to train and keep enough of our own people. Roughly 1 in 5 NHS staff is non‑British, and about 42% of doctors trained overseas. That’s dependence, not necessity. A serious country would train and retain English doctors and nurses, fix pay and conditions, and use controlled immigration as a top‑up, not a crutch.
4. Has mass immigration helped or harmed housing affordability?
For normal people, it has clearly harmed it. A typical home cost about 3× median earnings in the mid‑1990s; now it’s around 7–8×. Governments have piled record net migration on top of a housing system they already broke through under‑building, planning failures and loss of social housing. Migration isn’t the only cause, but it has added extra demand into a market where English buyers and renters were already getting squeezed.
5. Who actually gains from high immigration, if not ordinary English families?
The main winners are big employers, who get a larger pool of labour and less pressure to raise wages; the Treasury, which can claim slightly better GDP and debt numbers; and asset‑owners and landlords, whose property values and rents are shored up by extra demand. The people paying are younger and middle‑income English families stuck with soaring housing costs, rising bills and strained public services.